Why diagrams are underused in software engineering
Diagramming is an effective tool especially for visual learners like myself. It's most valuable when building or understanding software, making changes to products, and scaling existing applications. Nowadays, there are an extensive number of tools which can be used to assist with creating UML diagrams. That being said, for their overall value you don't find that many diagrams used in documentation or in demos. It becomes a bit of a shock when you join your first workplace and can't find any diagrams of how the main product works.
Their value
Diagrams are highly valuable for a multitude of reasons. A key one which hits home is that onboarding is made 10x easier with a detailed diagram of the components used in the product. Whilst it is important for new developer to go clicking through new codebases manually, diagrams do make this onboarding process quicker. It's also useful for senior developers to understand where there may be issues, scaling in particular. From my experience, weaker points are made more clear when they are drawn out. Needless to say, fixing these weak points improves the architecture and stability of the product.
Why they're underused
For all these positives, it becomes a mystery at first to understand why diagrams are so underused. However, after working on a product for a while, you begin to understand why this is the case. One of the primary reasons is the maintenance difficulty. The amount of changes that a software can go through within a sprint is significant, and having to diagram not only your changes but your team members is time consuming. It requires continuous ownership and isn't a priority compared to shipping real features. After some time, engineers trust the codebase more than random outdated confluence diagrams. They may at best visualise how it looks like in their head. It's just engineering culture.
What engineers use instead
Instead of these complex UML diagrams, most engineers prefer to do simple whiteboard sketches using tools like Miro for example (not sponsored). A good example is this sketch I drew when designing the comment flow for this blog. It's not formal and barely contains detail, but it explains the flow better than several paragraphs of documentation could:
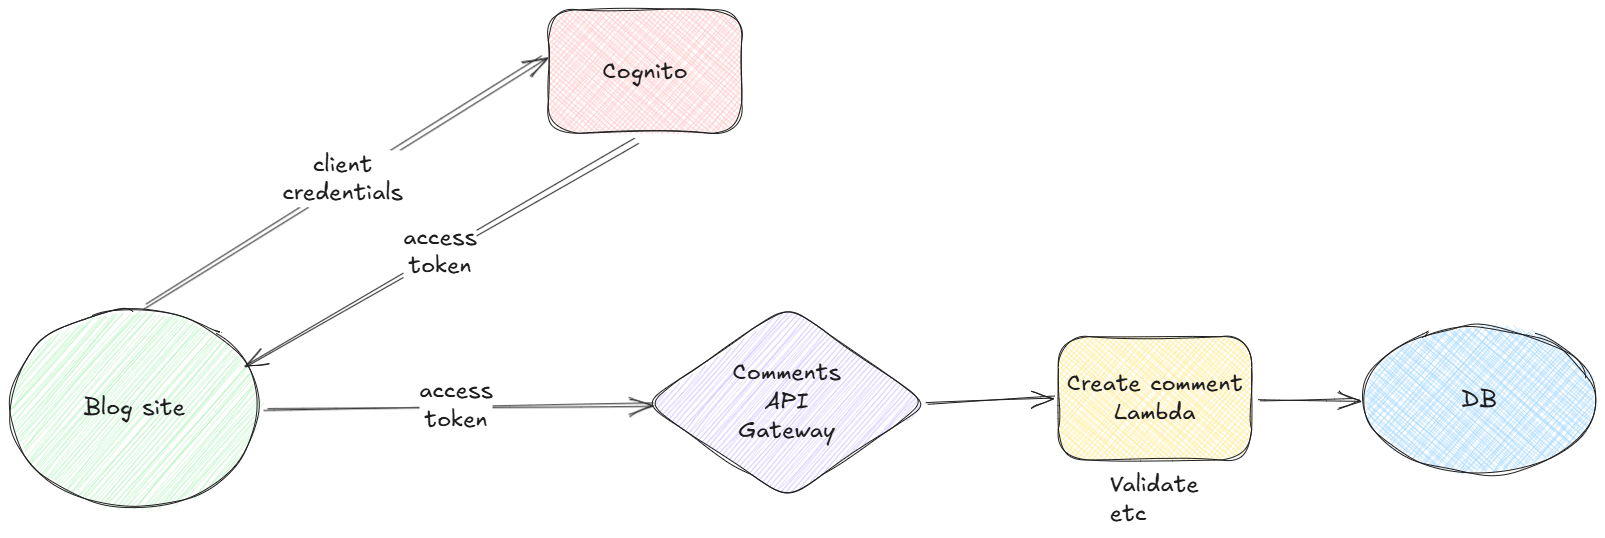
These diagrams are never complex, and at most contain around 50 elements. Most of the time these sketches are just demonstrating how the flow would work. The elements won't follow formal UML rules taught in school, and at best will be arrows and boxes. The reason is that the engineers already understand the specifics of the components via the codebase, and how they interact with each other.
The future
In the past year, new diagramming tools with AI have come out and made drawing up architectures much easier. It's likely they'll continue to evolve, so eventually there'll be advanced tools which can generate architecture diagrams directly from source code and cloud environments. This would remove the need for engineers to spend hours updating UML diagrams manually. In environments which are fast paced and have rapid development, this tooling is especially useful. Infrastructure can change weekly, and keeping diagrams is difficult. Ironicaly, diagrams may become more common in the future because engineers no longer have to maintain them manually
My take
Engineers don't dislike diagrams, they just dislike maintaining them. In reality, developers already visualise systems constantly either with whiteboards, Miro sketches, or just in their own head. In future, there'll likely be a lot more diagrams with AI handling the maintenance rather than humans.